Dana Schmid · 11 October 2026
Tidal Data Integration for Scheduling Deliveries at Seaside Gathering Spots
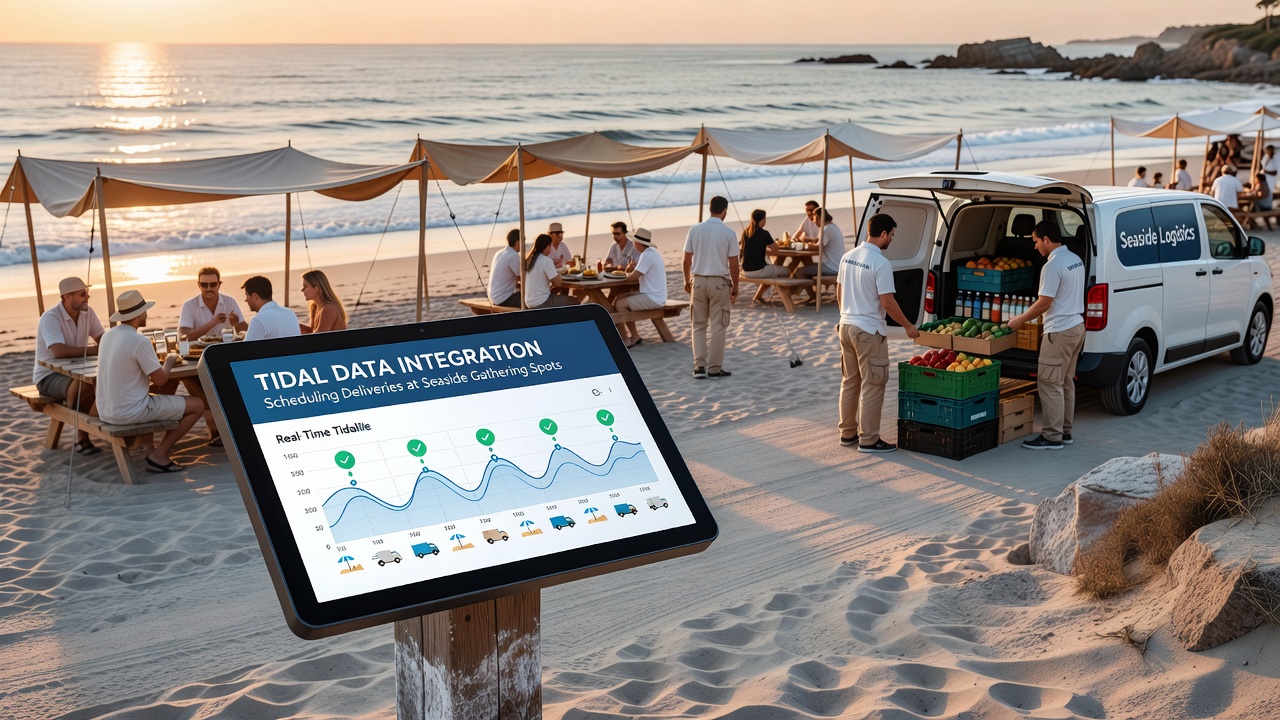
Coastal venues that host events, markets, and supply runs face constant shifts from rising and falling tides, and operators now combine real-time tidal datasets with logistics software to time deliveries around safe access windows. Researchers at marine institutes compile harmonic constants, satellite altimetry readings, and local gauge measurements into predictive models that forecast water levels at specific jetties, beach ramps, and pier approaches days or weeks ahead.
How Tidal Datasets Feed Delivery Systems
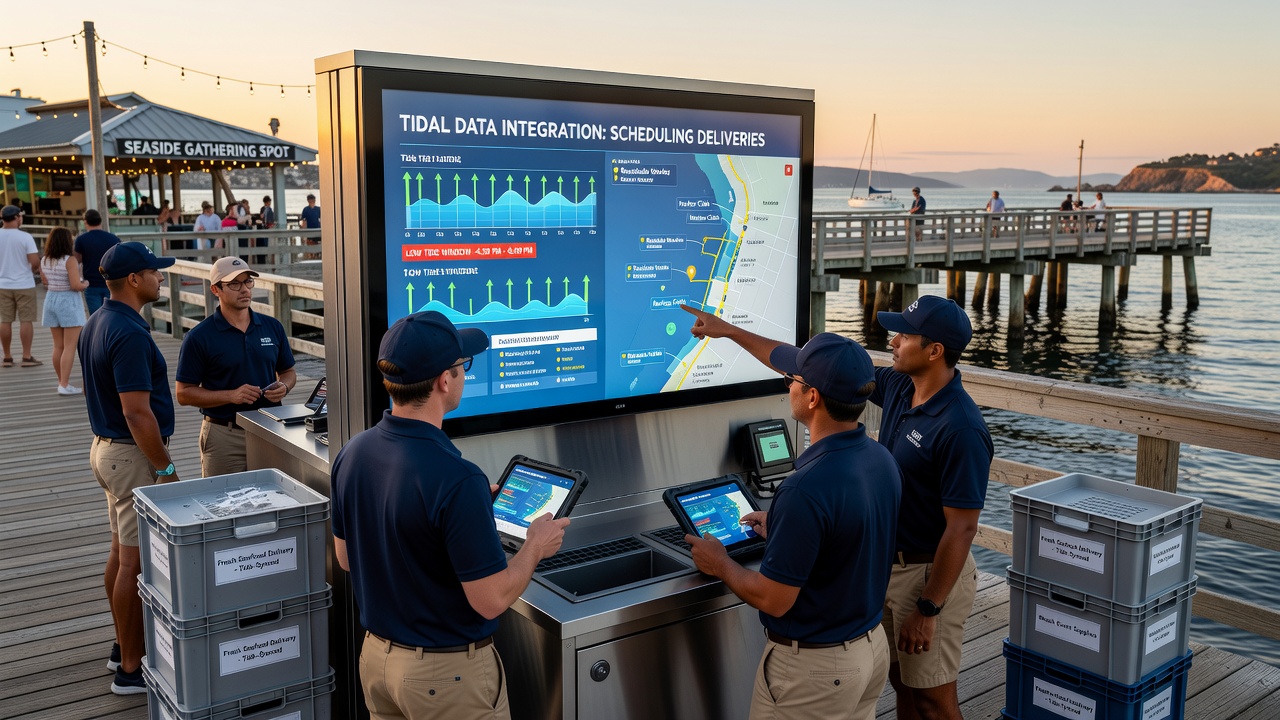
Modern platforms ingest hourly predictions from national hydrographic offices, then layer in wind-driven surge estimates and barometric pressure effects before outputting recommended arrival slots. Software dashboards display color-coded timelines that flag periods when water depth drops below minimum draft requirements for delivery vessels or when high water submerges loading zones at gathering spots. Logistics teams upload manifest details and vehicle dimensions, after which algorithms cross-reference those parameters against tide curves and produce adjusted schedules that avoid both grounding risks and flooding delays.
Port authorities in several regions publish open APIs that let third-party schedulers pull updated forecasts every fifteen minutes, while private weather services add localized corrections derived from buoy networks. Integration occurs through middleware that converts raw tidal values into operational constraints such as earliest safe arrival, latest departure, and required buffer times for loading and unloading at exposed sites.
Operational Adjustments at Coastal Event Sites
Event organizers at beachside amphitheaters and shoreline parks use these integrated tools to coordinate food trucks, equipment haulers, and waste removal services. One documented workflow begins with a weekly tide review meeting where planners overlay vendor arrival windows against predicted low-water periods that expose sand ramps or reveal submerged obstacles. Delivery drivers receive mobile alerts that include both the tidal window and any associated current speeds measured at nearby channels, allowing them to adjust departure times from inland depots accordingly.
During peak seasons, system operators run scenario simulations that test multiple delivery sequences against historical tidal anomalies recorded during storm events. These exercises reveal how a single delayed shipment can cascade into subsequent arrivals missing their safe windows, prompting contingency plans that include alternate inland staging areas or temporary elevated platforms.
Technology Components and Data Sources
Core elements include tide prediction engines maintained by government agencies, IoT sensors mounted on pilings that stream live water levels, and cloud-based routing engines that optimize multi-stop coastal routes. Geographic information systems map tidal inundation zones onto facility layouts so schedulers can visualize exactly which sections of a gathering spot remain accessible at any given hour. Machine learning layers refine forecasts by comparing previous predictions against actual gauge readings, gradually reducing error margins at locations with complex bathymetry.
According to figures released by the National Oceanic and Atmospheric Administration, integrated tidal scheduling has been tested at several U.S. coastal sites since 2023, with participating operators reporting measurable reductions in missed delivery windows. Australian maritime agencies have published complementary datasets through the Integrated Marine Observing System, enabling similar applications along Pacific and Indian Ocean shorelines where tidal ranges often exceed three meters.
Implementation Timeline and October 2026 Developments
Industry working groups have scheduled a series of regional workshops through late 2025 that focus on standardizing data formats between hydrographic offices and commercial logistics platforms. By October 2026, several pilot programs plan to expand coverage to additional gathering spots along the Gulf of Mexico and the Great Barrier Reef coastline, incorporating real-time current data alongside traditional height predictions. These expansions rely on upgraded sensor arrays that transmit measurements via satellite links, ensuring coverage at remote locations without terrestrial infrastructure.
Training modules developed by maritime academies now include modules on tidal data interpretation for supply chain managers, covering topics such as datum references, harmonic analysis basics, and interpretation of uncertainty bounds provided with each forecast. Certification programs emphasize verification steps that cross-check automated recommendations against visual observations at the delivery site before final commitment.
Conclusion
Tidal data integration continues to evolve as sensor density increases and forecast models incorporate additional environmental variables. Operators at seaside gathering spots gain access to scheduling tools that align delivery operations with predictable water level changes, supported by open datasets from multiple national agencies and refined through ongoing validation against field measurements. Expansion of these systems into additional regions remains dependent on continued investment in monitoring infrastructure and standardized data exchange protocols.